What to read on Central Asia's energy and climate: reports, data and trackers from outside institutions. The selection and the notes are ours — the materials themselves live with their publishers.
country
theme
showing 13 of 13
methodology2026en
PyPSA-SPICE Model Builder
Agora Energiewende
An open-source power system modelling framework built on PyPSA, with a ready-made model for Central Asia. It allows independent verification of other parties' scenario conclusions: node structure, investment periods and flexibility assumptions are defined explicitly and open to editing.
note A general-purpose framework: country-level assumptions are set by the user, so it should not be treated as a source of “benchmark” figures for Central Asia.
Free annual and monthly series of generation, capacity and emissions by country, with CSV export. A basic tool for checking any claim about the generation mix without waiting for national statistics.
note For the most recent year, net imports sometimes repeat the prior year's value — these figures are best not relied on for the latest period's cross-border flows.
Unit-by-unit status of the world's coal plants, including Kazakhstan: what is operating, what is under construction, what has been announced, and what is being retired. It allows tracking the fate of a specific unit, not just country-level totals.
note Statuses are updated in semi-annual releases and for Central Asia sometimes lag behind national sources.
Power Beyond the Grid: CASA-1000 community benefits
World Bank documents & reports
How the benefits of a major transmission line are distributed among communities along the route. The benefit-sharing mechanics tested on CASA-1000 are being carried over to Rogun and Kambarata-1, which is why the material matters for understanding the social terms of future hydropower projects.
Power sector of Central Asia: modernisation and energy transition
Eurasian Development Bank — analytical reports (CA power sector)
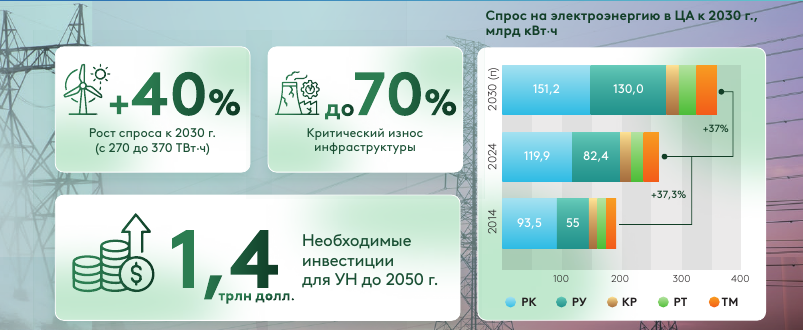
A recent regional review in Russian: demand trajectories to 2030–2035, an estimate of the region's investment needs, and a “middle path” scenario between inertial development and maximum decarbonisation. It gives a consolidated picture across five countries in one document.
note The 2024 baseline for several countries diverges from national statistics (Tajikistan's figures are notably higher than in the CIS UES compilation)—the numbers are worth checking against primary sources.
Electricity demand in Central Asia: 2014, 2024 and 2030 forecast, bn kWh
Eurasian Development Bank, free to quote with attribution · p. 1
›Key findings6
1Electricity demand in the region will grow by about 40% by 2030—from 270 to 370 TWh; it already grew by 37% in 2014–2024.
2Kazakhstan and Uzbekistan remain the largest consumers: 151.2 and 130.0 bn kWh by 2030, versus 119.9 and 82.4 in 2024.
3Infrastructure wear reaches up to 70%—modernising existing assets ranks ahead of new construction on the agenda.
4Achieving carbon neutrality by 2050 will require about $1.4 trillion in investment.
5The authors propose a “middle path” instead of maximum decarbonisation: modernising existing generation, flexible reserves, phasing out cross-subsidisation, and a common regional market.
6Global context that the report builds on: in H1 2025, renewables generated more electricity worldwide than coal for the first time (34.3% versus 33.2%).
read at publisher →Kazakhstan, Uzbekistan, Kyrgyzstan, Tajikistan, Turkmenistan · market, finance, policy
report2025en
Green hydrogen in Central Asia and the South Caucasus
IRENA
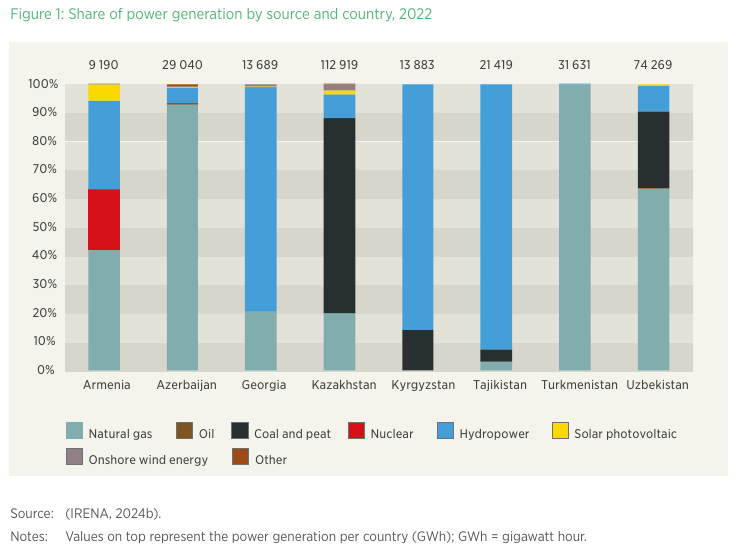
An assessment of the hydrogen segment that underpins large-scale claims in Kazakhstan. Useful for separating announced megaprojects from those with actual resource and economic backing. It also includes a handy summary of the generation mix and installed capacity across all countries in the region.
Electricity generation mix by source and country, Central Asia and the South Caucasus, 2022
IRENA, reproduction permitted with attribution · p. 12
›Key findings4
1The region's generation mix splits into two camps: Kazakhstan and Uzbekistan rely on coal and gas, while Kyrgyzstan and Tajikistan run almost entirely on hydro.
2Turkmenistan generates electricity almost entirely from gas, with other sources accounting for a negligible share.
3Installed capacity in 2024: Kazakhstan 24.6 GW, Uzbekistan 21.2 GW, Turkmenistan 7.0 GW, Tajikistan 6.5 GW, Kyrgyzstan 4.2 GW.
4Solar and wind generation is significant only in Kazakhstan (1.2 and 1.4 GW) and Uzbekistan (2.3 and 0.5 GW) so far; Kyrgyzstan and Tajikistan have zero.
read at publisher →Kazakhstan, Uzbekistan, Kyrgyzstan, Tajikistan, Turkmenistan · tech, carbon
report2025en
Transition Report 2025-26: Central Asia
EBRD publications
Macroeconomic and reform context for the region from the EBRD: what an investor looks at before sector-specific figures. Updated annually.
›Key findings4
1Kazakhstan's economic growth accelerated in H1 2025, driven by higher oil production at Tengiz amid steady consumer demand.
2New tax and budget codes take effect from January 2026: a VAT increase, a broader tax base, and tighter fiscal rules with less reliance on the National Fund.
3A national project envisages modernising more than 200 energy and utility system operators in 2025–2029, with tariffs tied to investment programmes.
4The EBRD's 2026 estimate: without deeper reforms, achieving carbon neutrality by 2060 remains in question—measurable sector targets and control mechanisms are needed.
read at publisher →Kazakhstan, Uzbekistan, Kyrgyzstan, Tajikistan, Turkmenistan · finance, policy
report2024en
Modernising Kazakhstan's coal-dependent power sector through renewables
Agora Energiewende
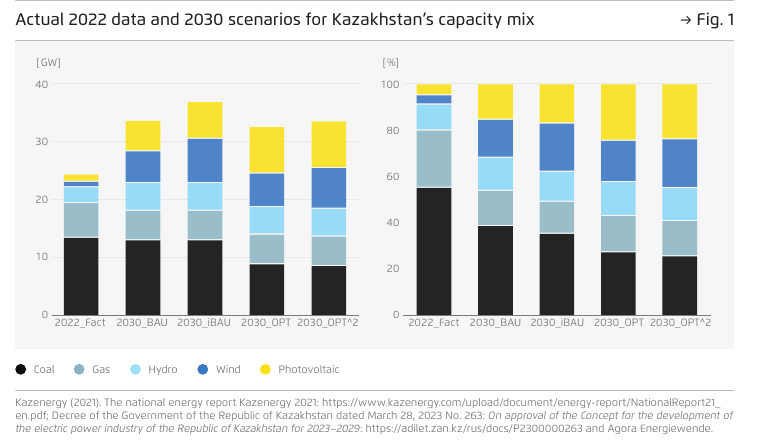
A scenario-based model of Kazakhstan's power sector through 2030 and beyond: how much wind and solar the system can absorb, whether new coal units are needed, and what flexible operation of existing thermal power plants delivers. System costs are shown for each scenario — a rare case where alternatives to the official programme are actually calculated rather than merely declared.
note The scenarios were modelled before the programmes announced in 2025–2026; the paper does not account for the Ministry of Energy of Kazakhstan's commissioning programme or the latest renewable auctions.
Structure of Kazakhstan's installed capacity: 2022 actual and four 2030 scenarios, GW and %
Agora Energiewende, CC BY-SA 4.0 · p. 12
1/2
›Key findings5
1The share of coal in installed capacity falls from more than 50% (2022 actual) to below 40% in inertial scenarios and under 30% in cost-optimised ones.
2In the scenario with joint optimisation of generation and the grid, coal's share of generation is 45% versus 54% in the inertial scenario, while solar and wind together account for about 20% of generation.
3The levelised cost of new solar plants and wind farms by 2030 is 47–62% of the cost of new coal generation.
4Coal's share of economic system costs falls from 39% in the inertial scenario to 25% under full optimisation.
5Emissions are geographically concentrated: Pavlodar region is the largest source, while Karaganda region accounts for 7–9% of sector emissions.
The social dimension of the coal transition: employment in single-industry towns, the sequencing of plant closures, mechanisms for regional support. The layer that is usually missing from energy scenarios, yet determines whether the transition is politically feasible.
›Key findings5
1Coal underpins more than electricity generation: it also fuels district heating, stove heating and metallurgy, so the issue extends far beyond the energy sector.
2The country has committed to carbon neutrality by 2060, but by the time the report was released, no coherent plan for reducing coal generation had emerged.
3The quality of the coal mined is low — high moisture, ash and sulphur content — which worsens pollution and complicates plant operation.
4Kazakhstan's climate is warming faster than the global average, and heatwaves push up electricity demand — and with it, demand for coal generation.
5The main difficulty lies not in the scale of employment in the sector but in its concentration: the dependency is concentrated in coal-mining regions, so measures need to be targeted.
A breakdown of barriers to renewables in Kyrgyzstan — tariffs, the grid, institutions. Explains why the country's stated potential has not translated into capacity for decades.
note 2022: tariff policy changes in Kyrgyzstan for 2023–2025 are not reflected.
›Key findings4
1The main barrier to renewables in the country is tariffs below cost: they deprive the sector of revenue and make investment in new generation unprofitable.
2Tariff reform is seen as the key that unlocks the rest: it gives the sector revenue while lowering the barrier to entry for distributed generation.
3A separate group of barriers is grid- and institution-related: the state of the grid, connection rules and the predictability of procedures affect investor confidence as much as price.
4The recommendations are split into short-term and medium-term, allowing progress to be checked against which steps have been taken and which are on hold.
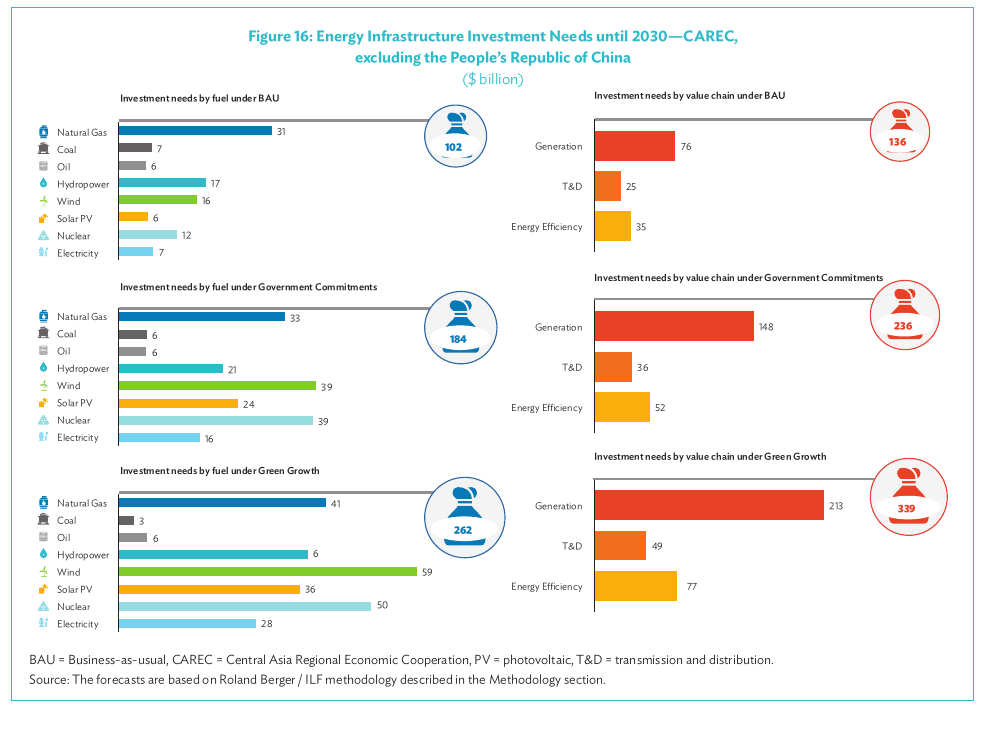
Demand forecast and investment needs estimate for CAREC countries. Useful as an external frame of reference: it shows the volumes development institutions target when planning financing.
CAREC energy investment needs (excluding China) through 2030 by scenario, $bn
Asian Development Bank, CC BY 3.0 IGO · p. 41
›Key findings4
1CAREC energy investment needs excluding China through 2030: $136 bn under the trend scenario, $236 bn under the government commitments scenario, and $339 bn under the “green growth” scenario — broken down along the generation-grids-energy efficiency chain.
2Generation remains the largest cost item across all scenarios: $76 bn to $213 bn.
3Grid and distribution investment requires $25–49 bn—markedly less than generation, though grid constraints are precisely what is holding back regional trade.
4By fuel, growth between scenarios is driven by wind ($16 bn → $59 bn) and solar ($6 bn → $36 bn), while coal investment falls from $7 bn to $3 bn.
read at publisher →Kazakhstan, Uzbekistan, Kyrgyzstan, Tajikistan, Turkmenistan · market, finance
report2019en
CAREC Energy Strategy 2030
ADB publications
A regional cooperation framework: priorities for grid interconnection and electricity trade. It explains the institutional arrangements that MDB projects in the region refer to.
note The 2019 strategy is context, not recent data.
›Key findings4
1The strategy rests on three pillars: energy security through interconnections, investment growth through market reforms, and greening the regional power system.
2The economic rationale for regional trade lies in the countries' differences: some are rich in fossil fuels and hydro resources, others lack sufficient resources of their own, and seasonal peaks do not coincide.
3The stated direction of reform is a shift from vertically integrated state monopolies toward unbundled, liberalized markets with private capital participation.
4Each pillar has measurable progress indicators, allowing verification of what has actually been done.
read at publisher →Kazakhstan, Uzbekistan, Kyrgyzstan, Tajikistan, Turkmenistan · policy, grid, market
report2014en
Central Asia Energy-Water Development Program (CAEWDP): Working Regionally for National Shared Prosperity
World Bank documents & reports
A visual introduction to Central Asia's energy-water nexus: why the region's power sector cannot be separated from water. The upstream countries (Kyrgyzstan, Tajikistan) hold hydropower potential and irrigation water, while the downstream countries (Kazakhstan, Uzbekistan, Turkmenistan) hold oil, gas and coal; seasonal peaks in demand and river flow do not align, so gains are possible only through joint management. A convenient starting point for understanding the logic of regional energy trade, and a clear map of Central Asia's power networks and water balance in one document.
note A World Bank policy brochure from 2014, not a study: the figures are illustrative and date to 2009–2012 (energy balance — ADB 2009, country profiles — World Bank 2012). It contains no recent data on capacity and trade; some maps draw on third-party sources (EC IFAS, Zoï Environment Network).
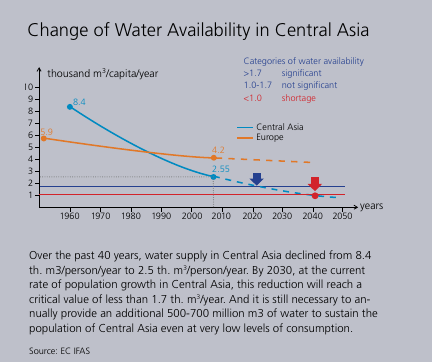
Decline in Central Asia's water availability: 8.4 → 2.55 thousand m³ per capita per year, actual and projected to 2050
World Bank (CAEWDP), data source EC IFAS · p. 3
1/2
›Key findings5
1Water availability in the region has fallen over 40 years from 8.4 to 2.55 thousand m³ per capita per year and, at the current population growth rate, will drop below the critical 1.7 thousand m³ by 2030.
2The power system has degraded: the region trades 90% less electricity than in the early 1990s, and around 2 mn households suffer from winter heat and electricity shortages every year.
3Efficiency delivers quick returns: in Uzbekistan, a 1% increase in pump efficiency saves $10 mn a year, and a 10% increase saves $188 mn a year region-wide; energy efficiency measures in one of the countries could cut energy costs by $12.3 bn by 2030.
4Benefits of regional cooperation: around $2 bn over three years from restoring intraregional energy trade, and $200 mn a year in new revenue from exports to South Asia under the first phases of CASA-1000.
5Irrigation is losing productivity to salinization: 50% of the region's irrigated land is waterlogged and saline, and in Turkmenistan the figure is 96%.
read at publisher →Kazakhstan, Uzbekistan, Kyrgyzstan, Tajikistan, Turkmenistan · grid, market, policy